August 15, 2020
First, a review of last week’s events:
- EUR/USD. Citing data from the Labor Department, optimists say that the U.S. economic recovery is gaining momentum. The pandemic-stricken labour market is beginning to recover and may have already overcome the worst stage of the crisis. Unemployment in July fell to 10.2% (against the April peak of 15%). 1.8 million people returned to work in July, a trend that continues for the third month in a row.
But, on the other hand, the revival of 9 million jobs in three months is only 43% of the 21 million lost in March-April. And 15.5 million Americans are still receiving unemployment benefits, which is more than twice higher than the maximum of the previous global financial crisis (6.6 million).
The market is waiting for the next stage of QE - pumping the economy with liquidity and other measures of fiscal stimulus, but Democrats and Republicans can not find common ground in Congress. President Trump does not want to inflate the next aid package for Americans too much, believing it will make them dependents sitting around the government's neck. But he is willing to make concessions to Democrats in exchange for cancelling postal voting in the upcoming US presidential election.
Negotiations go on, and in such an unobvious situation, the markets have taken a wait and see attitude. Although the S&P500 index continues to grow, it does not do it so vigorously. The yield on the 30-year US Treasury bonds seemed to have grown after a weak auction, but then fell along with a fall in risk sentiment in Europe associated with a worsening epidemiological situation and poor employment data. The disappointment of the latest macroeconomic data from China does not contribute to the growth of risk sentiment.
In general, uncertainty reigns across the board. As a result, both bulls and bears decided not to resort to active action, spending the last month of summer anywhere on the beach. The EUR/USD pair could not go beyond the 1.1700-1.1910 side corridor in three weeks, moreover, the fluctuation boundaries became even narrower, 1.1710-1.1865, the maximum volatility did not exceed 155 points, and the final chord of this quiet week sounded at 1.1840;
- GBP/USD. The forecast, which was announced seven days ago, turned out to be almost accurate: the UK GDP in the II quarter decreased by 20.5%. (For comparison, the Eurozone economy fell by 12.1% over the same period). However, this did not affect the quotes of the pound. As already mentioned, the GBP/USD pair has recently stopped playing independently and obediently follows the EUR/USD in the wake. So, if it moved east within 1.2980-1.3185 two weeks ago, now its trading range has narrowed to 1.3000-1.3140, the pair finished at 1.3085;
- USD/JPY. Recall that last week, most experts, supported by graphical analysis on H4, expected that the pair would try to test the 106.40 level again, and if successful, it would not stop there and go further up. This is exactly what happened: the pair went up against the background of growth in the yield of 30-year US Treasury securities, and, breaking through the resistance of 106.40, reached the height of 107.00. However, the dollar's growth soon stopped, and the pair rolled back downward, completing the five-day period in the zone of the strong mid-term support/resistance level of 106.60;
- cryptocurrencies. Bitcoin cannot overcome the $12,000 bar for the second week in a row. Another attempt was made, as is often the case, on the night from Sunday to Monday and ended in failure. After that, which again happens quite often, there was a powerful rebound downward, as a result of which the BTC/USD pair practically reached the $ 11,000 level on Wednesday, August 12. We have already written that this horizon has become a powerful new support for bitcoin, which is as difficult for the main cryptocurrency to overcome as the resistance of $12,000.
Bitcoin's fall came amid rising US government bond yields at the same time as a fall of about 10 per cent in the value of gold. At the same time, the overall background for BTC remains fairly favorable. The total cryptocurrency market capitalization grew by $13 billion in seven days, close to $370 billion. The Grayscale fund alone raised $1 billion in 10 days, which is more than in the entire II quarter of 2020. MicroStrategy Incorporated, which is one of the pillars of business intelligence, has declared Bitcoin as its main reserve asset and bought 21,454 BTC for a total amount of $250 million. Commenting on this move, CEO Michael Saylor stated that “Bitcoin, in their view, is a reliable means of saving and an attractive investment asset with long-term growth potential beyond holding cash."
By the evening of Friday August 14, Bitcoin had regained its position and returned to where it had already been at the end of last week - to the $11,750 zone, showing zero gain. But ethereum, the prospects of which we have repeatedly paid attention to, has once again pleased its investors, showing a gain of 13% and gaining a foothold above the level of $400. By the way, the above-mentioned Grayscale fund also showed an active interest in this top altcoin, having filed an application with the SEC (US Securities and Exchange Commission) for registering an Ethereum trust.
As for the forecast for the coming week, summarizing the views of a number of experts, as well as forecasts made on the basis of a variety of methods of technical and graphical analysis, we can say the following:
- EUR/USD. Only a clear breakdown of the 1.1700-1.1910 channel in one direction or another can give a clear idea of the dominant trend. In the meantime, amid dying activity, trend indicators continue to look north - those are 100% on H4 and 85% on D1. The picture is slightly different among oscillators. And although 75% of them on H4 and 70% on D1 are still green, the rest are already signaling that the pair is overbought, which is a rather strong signal for a trend reversal or a large-scale downward correction.
Graphical analysis on H4 draws a continuation of the sideways movement within 1.1700-1.1910. But according to the forecast on D1, the pair, having once again pushed off the support at 1.1700, may go up - first to the resistance at 1.1960, and then to the height of 1.2100.
30% of experts also expect further weakening of the dollar and growth of the pair. 25% of analysts agreed with the forecast for graphical analysis on H4. The remaining 45% are waiting for the pair to return first to the support at 1.1450, and then to decline to the 1.1240 zone. This will happen, however, not immediately, but within a few weeks. Moreover, in the medium term, this scenario is already supported by about 60% of analysts;
- GBP/USD. “Both the euro and the pound” - this is what the forecast for the GBP/USD pair looks like this week. Well, if not the same, it looks similar. As in the case of EUR/USD, 45% of experts vote for the pair to turn down in the coming weeks, and 60% in the medium term. 20% vote for the side trend, and 35% for further growth of the pair.
As for the trend indicators, 90% on H4 and 95% on D1 are painted green. Among the oscillators on H4, greens are only 60% and 40% have taken a neutral-grey position. On D1, 60% are also colored green, 35% are neutral grey and 5% have already changed their color to red.
Support levels are 1.3045, 1.2980, 1.2900, 1.2765 and 1.2670, resistance - 1.3125, 1.3185, 1.3200 and 1.3285;
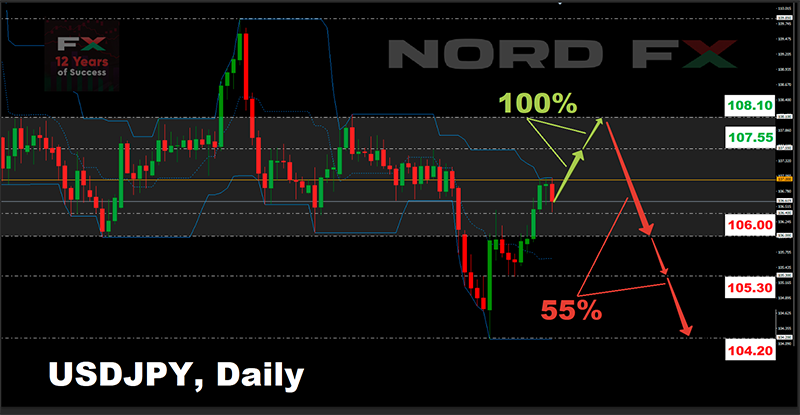
- USD/JPY. On Monday, August 17, there will be data on Japan's GDP for the II quarter, which, according to forecasts, decreased by only 7.6%, which is one of the best indicators among developed countries and once again proves that not only the Japanese yen, but the entire country as a whole is an excellent refuge from economic and financial turmoil. But so far 100% of experts predict the strengthening of the dollar and the growth of the pair in the coming days first to 107.55, and then to 108.10. It should be noted that the 106.00-108.10 zone is the range in which the pair has been trading 75% of the time over the past 20 weeks. And apparently that's why experts believe that the pair will definitely linger for a while in this interval. However, 15% of oscillators on D1 are already giving signals that the pair is overbought, and this fact must be taken into account when opening positions.
It is also necessary to take into account that the forecast of analysts for the end of August-beginning of September changes sharply, and 55% of them are waiting for a trend reversal and a new fall in the pair. The targets are 105.30 and 104.20.
- cryptocurrencies. As you know, there are at least two ways out of any situation. This is the case of Bitcoin — one way up, the other down.
According to the well-known analyst and TV presenter Max Kaiser, the growth of the price of the main cryptocurrency is positively affected by the withdrawal of capital from Asia against the background of increasing geopolitical risks. And the worse the relationship between the United States and China will be, the stronger will be the desire of Chinese citizens to move their capital abroad. And it is easiest to do it with cryptocurrency.
There is another fundamental factor playing on the side of bitcoin - this is the $10 trillion poured into the global economy in the form of a quantitative easing (QE) program. Recall that in the second quarter, the decline in US GDP turned out to be the largest in the entire history of observations - minus 32.9%, which suggests that the period of ultra soft monetary policy is likely to continue at least until the end of 2020. And some of the funds received within the framework of QE will be on the crypto market. Which, according to a number of experts, makes the growth of the BTC/USD pair inevitable. For example, Wall Street veteran Raoul Pal believes bitcoin could hit $100,000 over the next two years. And here, an important leading indicator may be the termination of the correlation of bitcoin with such stock indices as the Nasdaq and the S&P500.
But there is an opposite scenario as well. To understand which one, just look at the BTC/USD chart from a year ago. In August 2019, bitcoin's price also broke the $11,000 mark and even got to $12,300. But after several attempts to break higher, the quotes first fell to $10,000, and then flew down altogether, reaching the bottom in March around $3,800. There may be no such disaster this time, but the pair's correction to the $10,000 horizon is real enough. Moreover, the Crypto Fear & Greed Index has been at the level of 77-78 points for three weeks, which, according to its developers, suggests that the market is raged by strong overbought sentiment and needs to be corrected.
Interestingly, when giving a weekly forecast, most experts (55%) are inclined to believe that the BTC/USD pair will still break through the $12,000 resistance and rise to the $12,500-13,000 zone. However, when switching to the monthly scenario, 60% of analysts expect bitcoin to fall to $9,500-10,000 and offer to open long positions there.
NordFX Analytical Group
Notice: These materials are not investment recommendations or guidelines for working in financial markets and are intended for informational purposes only. Trading in financial markets is risky and can result in a complete loss of deposited funds.


